
We’ve moved.
 Dear Readers,
The Hechinger Report started Education By The Numbers as an experimental blog in 2013. It has since evolved into a weekly column, carried by both U.S. News & World Report and Washington Monthly, and now it is moving inside the new website of The Hechinger Report. Please visit us there.
There are several ways you can keep up with Education By The Numbers.
1. Visit hechingerreport.org/educationbythenumbers on the web to see new column posts and past columns.
2. Follow @jillbarshay or @hechingerreport on twitter. We always tweet on publication day.
3. To get an email alert when a new column is published, subscribe here.
We are transferring archived stories over to the new site, but will keep this older site alive for a number of months if you’d like to reference them.
Thank you for reading and please continue to comment. Your suggestions and criticisms keep this column interesting and honest.
Regards,
Jill Barshay
Hechinger Report contributing editor and founder of Education By The Numbers
School spending per student drops for the second year in a row
Despite occasional taxpayer revolts, the United States has a history of spending more and more each year on public education. From 1996 to 2008, spending per student, on average, steadily climbed at least 1 percent a year, after adjusting for inflation, according to the National Center for Education Statistics (NCES). But newer data is showing that this seemingly inexorable upward climb hit a plateau with the 2008 recession, and then began declining in 2010.
The most recent data, from the 2011-12 school year, released by NCES on Jan. 29, 2015, show that average per-pupil spending fell 2.8 percent, to $10,667, from the previous school year. That’s the second year in a row that per-student spending fell. In the previous year, 2010-11, per-pupil spending fell 1.6 percent from a year earlier — the first time that spending growth reversed and began declining. (These annual spending figures don’t include capital expenditures on buildings and renovations, which can spike from year to year.)
Per-pupil school spending fell by 1 percent or more in 37 states in the 2011-12 school year from 2010-11
(Use arrows to navigate and click on any state to see student spending data. Interactive map created by Jill Barshay of The Hechinger Report. Source data: Revenues and Expenditures for Public Elementary and Secondary Education: School Year 2011-12, NCES)
This $10,667 is an average figure that includes all public elementary, middle and high schools across the country. Some places, such as Washington, D.C., New York City and Boston, spent more than $19,000 per student in 2011-12. By contrast, average per-student spending in the state of Utah was just $6,441. The figures aren’t adjusted for cost-of-living differences. So you’d expect higher costs in pricier cities.
Not all states saw a decline in spending. Vermont boosted its education spending per student by 10 percent in 2011-12 from 2010-11. Both Delaware and New Jersey raised their spending per student, too. Among the 37 states that saw at least a 1 percent decline in spending, the steepest drops were in Arizona, Florida, Texas, Wisconsin and Washington, D.C.
The new reports (which can be found here and here) offer some clues as to why education spending is decreasing. One major reason is that federal funding to schools fell by more than 20 percent, or nearly $17 billion. That’s because schools had been big beneficiaries of federal stimulus funds to revive the economy after the 2008 recession, but by 2011, those funds had been exhausted. Local and state funding also fell by 0.6 percent and 1.2 percent, respectively. (Federal funds for low-income students, known as Title I funding, were stable).
How the drop in spending is affecting the quality of education is an open question. According to data from the Organization for Economic Cooperation and Development, there isn’t a correlation between how much a society spends on education and the performance of its school system. The United States has long been a top spender in these international rankings, but never a top academic performer.
On the other hand, the United States has a higher percentage of children in poverty than other top performing countries, and many experts say that poor children need more resources to catch up to their wealthier peers. Just last month, the Southern Education Foundation calculated that poverty is increasing so much in the United States that for the first time the majority of public school students qualified for free or reduced price lunch in 2012-13.
It is troubling to see the rise in poverty and a decline in education spending happen at the same time.
Related: New York City Independent Budget Office says per pupil spending is increasing
Related: Public-school spending dropped for the first time
Related: Per pupil spending by school district in the United States
Debunking one myth about U.S. teachers
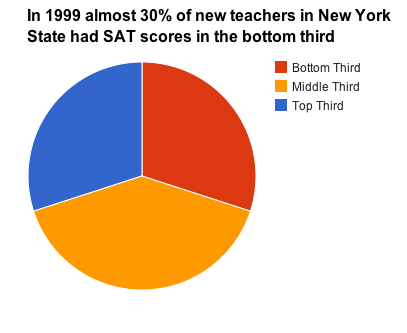
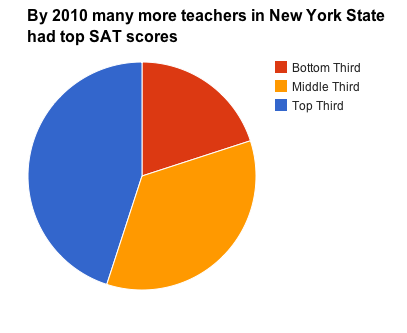
Charts by Jill Barshay. Data source: Who Enters Teaching? Encouraging Evidence that the Status of Teaching is Improving, Educational Researcher, December 2014
Back in 2010, McKinsey & Company issued a report that made a powerful argument: the world’s top performing school systems draw teachers from the best and brightest in their societies, but in the United States, almost half of new teachers come from the bottom third, as measured by SAT scores. It’s been cited by a New York Times columnist and by officials at the Organization for Economic Cooperation and Development to suggest what the United States might do differently to improve its education system.
But several new research papers suggest that U.S. teacher quality never declined as badly as that report said, and by 2010 had already turned around markedly for the better. For example, a detailed study of new teachers in New York state, published in December 2014 in Educational Researcher, found that at the worst point — in 1999 — almost 30 percent of new teachers came from the bottom third, as measured by SAT scores. Another thirty percent came from the top third. Ten years later, in 2010, the number of new teachers coming from the top third had risen dramatically, to more than 40 percent. And fewer than 20 percent of new teachers scored in the bottom third.

This article also appeared here.
The New York State data is echoed nationally. A 2013 study by Dan Goldhaber and Joe Walch at the University of Washington found rising test scores for new teachers. Another, as-yet-unpublished Stanford study confirms that the SAT and ACT scores of a typical new teacher had declined to the 42nd percentile in 2000 — a middling figure, not a bottom one. By 2008, those average scores had risen 6 percentage points, to the 48th percentile.
“The idea that teachers have consistently come from the lower third is just wrong,” said Susanna Loeb of Stanford University, a co-author of both the New York state paper and the forthcoming national study, in an email exchange.
Kate Walsh, president of the National Council on Teacher Quality (NCTQ), has been a critic of the quality of rookie teachers. She called the rising academic caliber of new teachers in New York state “good news.”
“But my problem is that there are still large numbers of teacher candidates who don’t meet that standard,” Walsh said. “This is a trend. This isn’t mission accomplished.“
To be sure, 48th percentile still means that 52 percent — more than half — of all SAT and ACT test takers scored higher than the average new teacher.
It has long been known that the academic abilities of new teachers declined from the 1960s through the 1990s. In large part, that’s because many bright women, who had traditionally gone into teaching, suddenly had many other professional opportunities open to them, from law and medicine to business. But it was unclear precisely how far the academic ability of the teaching profession fell. Newer data from the National Center for Education Statistics now tracks individual students as they graduate from college and enter various sectors of the workforce (known as the Baccalaureate and Beyond surveys). And that is why education researchers can now more accurately calculate the SAT and ACT scores of people who enter the teaching profession.
Of course, SAT and ACT scores are an imperfect measure of academic ability. And some experts argue that teachers who were once struggling students themselves can make the best teachers. Still, rising test scores are a sign that the teaching profession is becoming more desirable to young adults.
In the unpublished national paper, a chart shows that new teachers in 2008 came pretty evenly from throughout the SAT distribution. Back in 1993 and again in 2000, new teachers were more likely to have had a SAT score in the lower percentiles. In other words, 20 years ago there were very few top SAT scorers entering teaching. Now there are many more. The authors found that schools in big cities with high minority populations were particularly successful at recruiting teachers with higher SAT scores.
When you dig deeper in to the national numbers, it shows that math SAT and ACT scores are driving the improvement. Math scores for teachers reached a low in 2000 and then rose strongly. Verbal test scores increased only modestly.
In contrast to the good news in public schools, the authors found that the academic skills of teachers going into private elementary education have fallen. Back in 1993, the typical hire at a private elementary school had SAT scores that were 4 points higher than her or his public school counterpart. By 2008, they were 5 percentage points lower. Because of the SAT slide of new private elementary school teachers, the “ability gap” (measured by these tests) between private and public school teachers shrank to nearly zero in 2008. Private high school teachers continue to have higher SAT scores than public high school teachers.
There could be a variety of explanations for why stronger students are going into teaching. One hypothesis is that schools could be pickier in their hiring during an economic recession, with fewer spots to fill and more candidates. But it’s also possible that policy changes that stiffened teacher credentialing, including new requirements in the 2001 No Child Left Behind education act, raised the standards for incoming teachers. Teach for America, which recruits high-ability students to teach, contributed to the SAT score increase, too, but those recruits weren’t numerous enough to account for most of the rise. NCTQ’s Walsh credits the efforts of former New York City Education Commissioner Joel Klein to recruit high-caliber college graduates to teach in low-income schools, and said she believes that the city then became a role model for the rest of the state.
The improved caliber of new teachers hasn’t yet translated into improved performance, in the form of higher international test scores. At least among 15-year-olds tested on the Program for International Student Assessment (PISA), the U.S. didn’t improve in the most recent 2012 tests. Maybe we (or McKinsey) will have to come up with another reason that the U.S. school system isn’t ranking at the top internationally.
Three lessons from data on the best ways to give feedback to students
 Proponents of computerized instruction often point out that software can give instant feedback to students. And that helps students learn more. That’s why a personal tutor can be so powerful. He or she can immediately react when there’s a misunderstanding and provide an explanation or a hint. But the truth is, educators don’t really understand how a teacher’s feedback leads to learning and exactly what kinds of feedback work best.
A team of researchers led by Fabienne M. Van der Kleij from the Cito Institute for Educational Measurement and the University of Twente in the Netherlands set out to see if the universe of computerized instruction might offer some clues about what kinds of feedback are most effective. Their paper, “Effects of Feedback in a Computer-Based Learning Environment on Students’ Learning Outcomes: A Meta-Analysis,” was published online January 8, 2015 in the Review of Educational Research.
This article also appeared here.
Though the researchers initially found more than 1600 studies that looked at how students learned from computer responses to their answers, they determined that only 40 of these studies were high quality ones that directly compared different types of feedback to see which were most effective. Most of the studies were aimed at university students and the researchers lamented how few studies looked at how younger students respond to computerized feedback.
But from analyzing the 40 high-quality studies, here’s what they learned.
1) Rethinking “try, try again.”
Many software programs alert a student when an answer is wrong, often asking the student to try again until he gets the right answer before moving on to the next question. (For example, the popular Raz-Kids reading program used in many elementary schools asks students a series of multiple choice comprehension questions about each book. The computer marks incorrect answers with an X).
You’d think that getting a student to discover his mistake and correct his error would be incredibly effective. But just the opposite is true. Simply marking wrong answers was the worst form of feedback. In some cases, students examined after receiving this kind of try-again feedback had learning outcomes that were lower than students who hadn’t received any feedback at all on the same initial set of questions.
Why doesn’t it work? The authors explain that students typically click on a different answer, without thinking, and keep clicking until the computer marks it right. The lead researcher, Van der Kleij, said that her findings here about computerized feedback echo what other researchers have found in an an ordinary classroom environment. “Over time research has recognized that a trial-and-error procedure was not very effective in student learning, because it does not inform the learner about how to improve,” she wrote in her paper.
Perhaps teachers should reconsider the common practice of flagging incorrect answers on homework. I’ve often wondered what it does to a student’s motivation to see work marked with red x’s but no insight on how to improve.
Spoon-feeding the correct answer to a student worked better. For example, if a student got “what is 10 x 10?” wrong, telling him that the answer is 100 was helpful, at least on simple learning tasks, such as this type of math drilling or learning foreign vocabulary words.
2) Explanations are the most effective
Spoon-feeding doesn’t work as well for more complicated things, such as using new vocabulary words in an essay. More learning occurs when the computer system offers some sort of explanation or a hint to help the student understand what he got wrong.
But the boost to student learning varied widely, the Dutch researchers found, perhaps because the quality of the hints or explanations varied widely too. In some of the underlying studies that Van der Kleij looked at, an explanation consisted of the working out of an entire math problem, step by step. In others, it merely suggested a procedure that could be used. Still other times, the computer gave what educators call “metacognitive” feedback, such as asking the student, “Can you think of any similar tasks you have solved in the past?
In one of the most successful of the 40 feedback studies reviewed by the authors, Alfred Valdez, a professor at New Mexico State University taught a basic statistics lesson to university students using instructional software. But before the lesson began, he told the students they had to get 90 percent of the questions right. When students got a question wrong, a hint automatically popped up so that they could try again. (For example, if a student erred on the question, “Would an unusually large number in a data set affect the median or the mean more?”, the computer reminded the students what the definitions of mean and median are.) Valdez believes the key to his experiment’s success was the goal-setting, an idea he took from the business world.
Hints “are the most difficult. Learners don’t typically like that kind of feedback,” Valdez said in an interview. “They have to work more, so you need to give them an incentive to use the feedback and not just ignore it.”
A big problem that Valdez had was coming up with a good hint ahead of time. “Humans are much better equipped to get into a student’s head and figure out where the misconception is coming from and guide them,” he said. “The problem with computer-based instruction is that I had to come up with general principle that might be good for everyone, but wasn’t [necessarily] good for each individual student.”
Customizing feedback isn’t easy. Valdez said he once saw an experiment where students were offered a multitude of feedback choices and they could pick the ones they found most useful. Naturally, students picked the explanation that required the least thinking on their part.
3) Later is sometimes better
When to give feedback depends upon how complicated the material is, the researchers found. When doing simple things like memorizing vocabulary or learning times tables, immediate feedback after each question was best. But when absorbing something more complicated, students learned more when the feedback was delayed a bit, perhaps until after the student had answered all the questions.
In our email exchange, Van der Kleij cautioned against making any computer-to-human leaps of logic and applying these lessons to ordinary classrooms. Students might ignore feedback more on a computer, for example — although there’s also evidence that students ignore much of the feedback that teachers write in the margins of their papers. But she did find it interesting that the research on computerized feedback is confirming what education experts already know about ordinary feedback. What’s interesting to me is why education technology makers aren’t taking more advantage of that research to improve feedback.
The push for standards is seeping into arts education
Advocates for arts education are in the midst of a counter offensive. Arguing that post-recession budget cuts and Bush-era testing policies have prompted schools to cut art (in order to spend more time prepping kids for math and reading tests), they’ve come up with an idea: convince states to adopt new art standards –à la Common Core — to get schools to focus on art again.
Last year, a coalition of art groups unveiled their new National “Core Arts Standards,” for the teaching of music, visual art, dance and drama. There’s a new emphasis on making cross-disciplinary connections with, say, math or literature — not just learning the notes on your flute. They’ve even added a fifth art category: media arts.
25 States and D.C. required course credits in the arts for high school graduation in 2014
(Use arrows to navigate. Interactive map created by Jill Barshay of The Hechinger Report. Source data: Arts Education Policies by State 2014, NCES and AEP)
Already, three Midwestern states — Arkansas, Kansas and Nebraska — have adopted or are moving to adopt versions of the new standards. And 10 more states are considering it, according to Narric Rome, Vice President of Government Affairs & Arts Education at Americans for the Arts, a Washington, D.C. advocacy group.
This article also appeared here.
“We’re spending our time on the state level,” said Rome, who says he used to spend more of his time lobbying Capitol Hill and federal agencies. “That’s where we see action for arts education.”
This state activity is catching the attention of the data geeks over at the National Center for Education Statistics, which released a table of Art Education Policies by State in December 2014 using data collected by the Arts Education Partnership (AEP). The table makes clear that all 50 states already have art standards. Some of them are believed to be 20 years old. But implementation varies considerably. Some states require schools to offer art. Others don’t. In many cases, only a small percentage of students take art classes.
One category that lobbyists like Rome want to boost is the number of states that require students to take at least some sort of art class to graduate from high school. Just 25 and the District of Columbia do now. “We make the argument that a complete education isn’t complete without the arts. One way to have that is to have a graduation requirement,” said Rome.
Rome admits that high school requirements are an imperfect way to promote arts education. California, for example, doesn’t require art for graduation. And yet, Rome says that California has “very good” art education programs in many of its public schools.
Testing: 17 States required assessment of student learning in the arts in 2014
(Use arrows to navigate. Interactive map created by Jill Barshay of The Hechinger Report. Source data: Arts Education Policies by State 2014, NCES and AEP)
The trick for arts advocates is to figure which policy levers to pull that will actually increase funding for art classes and allow more children to take them. On one hand, they could convince state policy makers to test art, which 17 states already do, just like they test math or reading. What gets tested gets taught, after all. And testing can prove to critics that art is a serious subject and not just about gluing popsicle sticks or appreciating music.
But the arts are wary of testing, too. Not only has art been a victim of math and reading tests, but also no one wants to see misguided tests that would ask students to, say, memorize all the impressionist painters.
“That’s the narrow eye of the needle we’ve been trying to get through,” explained Rome. “We don’t want to be part of more testing. But we do think that assessment in the arts is a validation of arts education and why these new standards are important.”
But ultimately, it’s unclear if new standards will mean more art for more students.
What the state data don’t reveal is how many and which students are currently receiving art instruction and how much of it they’re getting. Every decade the federal government issues a large report on arts education throughout the country, Arts Education in Public Elementary and Secondary Schools, and the most recent data from 2010 confirms that low-income schools don’t offer music and visual art as much as high-income schools do. But it’s difficult to tell how much art a typical student is getting. Just because a school offers art doesn’t mean that all students have access to it or are taking advantage of it.
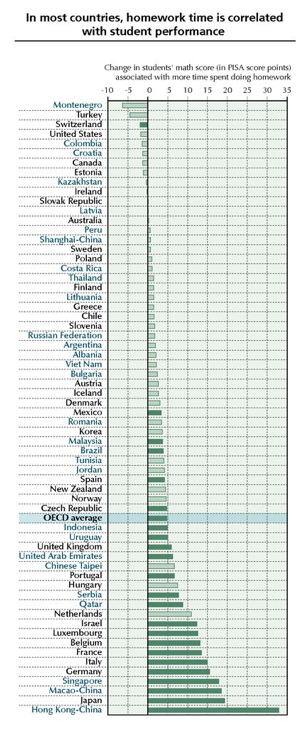
Homework matters depending upon which country you live in.
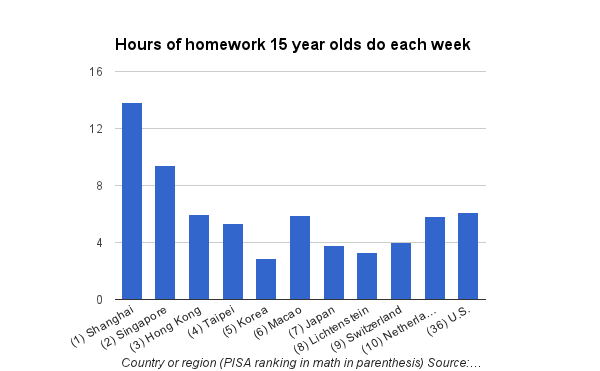
Chart created by Jill Barshay, data from OECD
For years, researchers have been trying to figure out just how important homework is to student achievement. Back in 2009, the Organization for Economic Cooperation and Development (OECD) looked at homework hours around the world and found that there wasn’t much of a connection between how much homework students of a particular country do and how well their students score on tests. Some top achieving countries, like Singapore, assign their students lots of homework. But Finland, for example, succeeds without much homework. On average, Finnish students do only about three hours of homework a week, yet in 2012 they scored sixth highest in the world in reading and 12th highest in math on the OECD’s international test, known as PISA or Programme for International Student Assessment.
This article also appeared here.
But now, five years after the earlier homework study, OECD researchers have drilled down deeper into homework patterns, and they’re finding that homework does play an important role in student achievement within each country. Specifically, they found that homework hours vary by socioeconomic status. Higher income 15-year-olds tend to do more homework than lower income 15-year-olds in almost all of the 38 countries studied by the OECD*. Furthermore, the kids who are doing more homework also tend to get higher test scores. So the authors conclude that homework is reinforcing the achievement gap between the rich and the poor.
It’s not just that poor kids are more likely to skip their homework, or don’t have a quiet place at home to complete it. It’s also the case that schools serving poor kids often don’t assign as much homework as schools for the rich, especially private schools, explained Francesca Borgonovi, one of the authors of the study, titled “Does Homework Perpetuate Inequities in Education?”
“When you look within countries at students who are learning in the same educational system and they do more homework, then those students do much better,” said Borgonovi. “There is an advantage for putting extra hours in homework.”
“Does Homework Perpetuate Inequities in Education?” OECD
A stark example of this rich-poor homework gap is in Singapore. Students in the top quarter of the socio-economic spectrum spend about 11 hours on homework a week, 3 hours more than low-income students in the bottom quarter of the socio-economic spectrum. Each extra hour of homework was associated with 18 more points on the PISA math exam. So three hours adds up to more than 50 points. That’s huge. To put that in perspective, if you added 50 points to the average U.S. math score, we’d be a top 10 nation instead of number 36.
A key factor is what Borgonovi said about “learning in the same educational system.” Some school systems are designed to rely on homework, perhaps using independent study as a substitute for what could otherwise be learned in school. “If you are prepared to change the system, that’s great,” said Borgonovi. “But until you do so, if the system is based on homework, then you should do more of it.”
Students in Shanghai, a region in China that now leads the world in PISA test scores, do a whopping 14 hours of homework a week, on average. Wealthier students there do 16 hours. Poorer students do just under 11 hours. Interestingly, however, there was no association between the extra homework hours that the wealthier Shanghai kids put in and their PISA test scores. Perhaps that’s because there are diminishing marginal returns to homework after 11 hours of it!
Indeed, most countries around the world have been reducing the amount of homework assigned. Back in 2003, the average time spent on homework worldwide was about six hours a week. In 2012 that shrank to about five hours.
But the United States has been bucking this trend. The typical 15-year-old here does six hours a week, virtually unchanged from a decade ago and possibly rising. Wealthier students typically do eight hours of homework a week, about three hours more than low income students. But unlike in most countries, where more homework is associated with higher PISA test scores, that’s not the case here.
“For the United States, we don’t have homework reinforcing inequality,” Borgonovi said.
Another team of researchers, Ozkan Eren and Daniel J. Henderson, found mixed results for how effective homework is in the United States, in a 2011 study, “Are we wasting our children’s time by giving them more homework?” published in the Economics of Education Review. For math, there were huge benefits for the 25,000 eighth graders they studied. But not for English, science or history. And the math boost was much stronger for white students than for blacks. In other words, when a typical black student did more homework, his math test scores didn’t go up as much.
That’s perhaps a clue that even if you could magically get low-income children in other countries to do as much homework as their high-income peers, as the OECD researchers are suggesting, you might not raise their PISA test scores very much.
Indeed, Borgonovi isn’t really advocating for more homework. She says that high quality teachers and instruction are much more important to student outcomes than homework is. To be sure, some amount of homework is good, Borgonovi said, to teach kids how to plan ahead, set goals and work independently. But more than four hours of homework a week, she said, isn’t very beneficial.
“It would be better to redesign the system to have less homework,” said Borgonovi. “But that is hard to do.”
* The OECD looked at socio-economic status and not income exclusively. So the child of a university professor, for example, might still be in the high income category even if his parents don’t make very much money.
Top 10 education data stories of 2014
Jill Barshay
For my year-end post, I’m highlighting my 10 favorite Education By The Numbers stories of the year. Thank you to everyone who has read and commented on my weekly stories about education data and research. I look forward to continuing this conversation with you in 2015. If you would like to receive an email notification when the column comes out each week, please click here and fill out the form.
1. Great English teachers improve students’ math scores (January 24, 2014)
One way to boost math achievement? One Stanford study suggests great English teachers can help.
2. Three lessons from data on children’s reading habits (December 1, 2014)
Mining the data of a popular reading software used in schools reveals a secret to turbo-charging a child’s reading ability.
3. Three lessons from the science of how to teach writing (October 27, 2014)
Put grammar books aside and write on a computer — every day.
4. New research suggests repeating elementary school grades — even kindergarten — is harmful (October 13, 2014)
One study finds that kids who are held back young are less likely to graduate from high school.
5. Homeless students increase by 58 percent in past six years (September 29, 2014)
Interactive data visualization map shows alarming increase in homeless students throughout the United States.
6. Right and wrong methods for teaching first graders who struggle with math (July 21, 2014)
One large study suggests that traditional instruction and rote practice works best for young students who are struggling with math.
7. Education researchers don’t check for errors — dearth of replication studies (September 22, 2014)
The field of education isn’t doing what it should to confirm which teaching approaches work.
8. Researchers give failing marks to national effort to measure good teaching (May 13, 2014)
Value-added teaching models were the lynchpin behind the landmark California court decision that found that low-income minority students had worse teachers than high-income students and struck down teacher tenure rules. But one study shows no association between student test score gains and high quality teaching.
9. High school wasteland: Demographic changes do not explain test-score stagnation among U.S. high school seniors (May 7, 2014)
Results from national reading and math tests show that U.S. high school seniors haven’t improved in more than 20 years. By contrast, scores for fourth and eighth graders have been steadily climbing.
10. Universities with 10 largest endowments raise tuition for low income students more than for high income students (March 14, 2014)
Our data crunching here at The Hechinger Report shows tuition hikes are disproportionately falling on low income students at Harvard, Princeton, Yale and other top universities.
Summer school seems to work better for math than for reading

RAND Corporation photo
Back in 2007 a team of Johns Hopkins researchers found that low-income children tended to improve in reading just as much as their wealthier peers did during the school year. The problem, at least for a group of Baltimore children these researchers studied for 18 years, was summertime. During those three idle months, the poorer children’s reading skills slipped a lot. The researchers found that two-thirds of the ninth grade reading achievement gap could be explained by summer learning loss during the elementary school years. Educators have been aware of the summer slide phenomenon since the academic school year was created. But this seminal study documented exactly how it disproportionately affects disadvantaged students.
Now, what to do about it? One obvious idea is to send at-risk children to summer school. But does it work?
Related: Will ‘creative’ and ‘hands on’ summer school foster a love of learning?
This article also appeared here.
The Wallace Foundation is trying to learn just that, with help from researchers at the RAND Corporation. Beginning in 2013, the foundation started financing a summer program that includes both academic classes, all taught by certified teachers, and fun activities, such as sailing or rock climbing, in five cities — Boston, Dallas, Pittsburgh, Rochester, NY, and Jacksonville, FL. Low-income families with third grade children were invited to apply and attend free of charge. But the programs had spots for only about 3,200 of the 5,600 applicants. That excess demand created an unusual opportunity to conduct a randomized controlled experiment — or at least as close to one as you can get in education. The researchers could compare the outcomes of the summer program students to those who also applied, but weren’t selected.
Results after the first summer were mixed, according to a preliminary report, released in December, 2014.
The summer-program students scored much higher on a 2013 fall math test than the control group did. Those higher math scores were equivalent to roughly a fifth of what kids this age typically learn in a school year.
But there were no differences in the reading ability or social-emotional skills between the two groups of students.
About 40 percent of the children who didn’t attend the Wallace summer programs disclosed on surveys that they had attended another summer camp or program. That could be muddying the results here, and understating the benefits of going to summer school. But the researchers also compared control group students who attended another summer enrichment program with the majority of the control group kids, who did nothing, and found no difference in their academic outcomes. So those concerns were somewhat alleviated. (See page 38 of the study).
Related: In Mississippi, summer vacation puts lower-income learners at risk
Digging deeper into the data, RAND researcher Jennifer McCombs found that the kids who’d had higher quality summer reading instruction from an experienced third-grade or fourth-grade teacher did see higher scores on the fall reading assessment. McCombs explained that the reading curriculum was quite open-ended and not very scripted. So teachers who’d had prior experience teaching reading to children of this age knew how to teach it, keep the kids engaged and check for understanding.
“It was a very short program, five to six weeks tops,” she said. “Teachers had to hit the ground running and those who had experience with this age had an advantage.”
By contrast, prior math teaching experience was less important with math. “The math curriculum was more scripted, if you wanted to fall back on the teacher’s guide,” McCombs explained.
The Wallace Foundation is using this information to improve the summer program. But already it shows that it’s not sufficient to hire inexperienced teachers to read books to kids, on the cheap. It may ultimately be quite costly to create effective summer programs that can reduce summer learning loss.
RAND Researchers are following these children to see whether summer learning gains persist throughout the 2013-14 school year, and after a second summer of the learning program in 2014.
Related: Are the lazy days of summer killing our nation’s academic progress?
To repeat, or not to repeat? California algebra study creates commotion
I received a lot of reaction on Twitter to my Dec. 15 column, “California study finds harm for some in repeating algebra, questions whether it benefits anyone,” and would like to respond.
The published study that I was analyzing highlighted the fact that the average student who had repeated algebra improved his grades and test scores. It would seem that this study is evidence that repeating algebra works, and therefore that my headline (“California study finds harm for some in repeating algebra, questions whether it benefits anyone”) and story are flat wrong.
But during my reporting, I interviewed the lead author, Anthony Fong. When I asked him why he thought the weaker students were making gains by taking the same algebra course again, the author alerted me to how small the gains were. These kids are still getting D’s, and still failing to score as “proficient” on the state’s end-of-year exam.
The study states this:
“74.1 percent of the students passed algebra I with an average grade of ‘D-‘ or better when they attempted Algebra I for the second time. More than a third of repeaters received grades that averaged between an “F” and a “D,” and more than half scored either “below basic” or “far below basic” on the algebra I CST in their second attempt.”
Table 2 on page 7 of the study further spells out how slight the improvements were.
To my mind, these gains were so small that it hardly seemed students were benefiting from taking the same Algebra I class again. Certainly, they did not master algebra. Reasonable people can disagree with me, and say that any improvement in grades and test scores, no matter how small, constitutes a benefit.
Data is often in the eye of the beholder. And this is a good example of data analysis that can be used differently on different sides of an argument.
California study finds harm for some in repeating algebra, questions whether it benefits anyone
AP Photo
One of the most often repeated courses in U.S. high schools is algebra. Teachers and school leaders understandably worry whether a student who can’t solve basic equations should move on in math, to geometry or advanced algebra. So the student takes algebra again. Sometimes, even students with B’s in algebra are asked to repeat it because their teachers are concerned that they haven’t mastered the material.
Unfortunately, a growing body of research is showing that when you march a teenager through the same algebra class again, it doesn’t help much. And this is part of an overall picture of students repeating classes or an entire year of school without good results. Without addressing a child’s underlying learning issues or missing foundations, repetition alone is rarely effective and sometimes harmful.
A new California study, conducted for the U.S. Department of Education, reinforces this. It found that students who had gotten at least a C in the course the first time around, and had passed the state algebra assessment, were harmed by taking the course a second time. Both their grades and test scores declined. Lower performing students improved somewhat — for example, students who had gotten an F the first year typically got a D the second year — but very few of them mastered the material. More than 80 percent of the repeaters still scored below the “proficient” threshold on the state algebra test.
This article also appeared here.
“This is what is going on in schools across the country: It’s not an option to do anything else than retake the class with the same book and same curriculum,” said Anthony B. Fong, the lead researcher at WestEd who conducted this November 2014 study, “Who Repeats Algebra I, and How does initial performance related to improvement when the course is repeated?”
Related: Data on taking algebra in eighth grade, and the watering down of U.S. math instruction
Fong and his WestEd colleagues studied a northern California school district in the San Jose area with an alarmingly high rate of algebra repeaters — 44 percent of the students are taking algebra twice. The East Side Union High School District serves almost 25,000 students. The researchers studied a group of 3,400 students who started seventh grade in 2006 and followed them through graduation from high school. Most of the students repeated algebra in 10th grade after doing poorly in algebra in ninth grade. But many of the students originally took algebra in eighth grade and repeated it in ninth.
Among the higher performing students (C or better) who repeated, half saw their scores on the algebra state assessment fall by an entire performance level from “proficient” to “basic”. Fong’s data analysis doesn’t explain why the higher performing students do worse the second time around, but he suspects that these students were demoralized by being held back in math and lost their motivation.
You might question why teachers are holding kids back in algebra if their grades are decent. It’s a bit of a mystery. In informal conversations, Fong learned that teachers were concerned that some students with passing grades weren’t ready to move on. For example, some teachers give high grades to students who try hard and hand their homework in even if their calculations are consistently wrong. Also, the California State Test scores were often not available until the end of summer or after school started and couldn’t be used by teachers to help them make placement decisions.
The purpose of the study is to provide guidance to schools on whether students should repeat algebra. “If you have a kid who’s on the borderline of repeating algebra or moving on, if you’re in doubt, it seems like it’s better to move on,” said Fong.
As for the majority of struggling math students, Fong said this study doesn’t definitively conclude whether students should or shouldn’t take algebra again. They tend to improve slightly, but not as much as might be hoped.
This study confirms an earlier 2012 California study that struggling students aren’t mastering algebra by repeating it. That study looked at only ninth graders across 24 school districts in California, but also found that students who took algebra a second time were unlikely to score “proficient” on the state exam following the second attempt.
The problem is, what do you do with the student who struggles with algebra? Simply promoting a student who has failed algebra I to algebra II seems silly, too.
One promising algebra intervention, studied in Chicago, was a double dose of algebra each day. Unfortunately, there aren’t that many classes like this available for struggling students across the country.
Perhaps there are clues from the research on retention and social promotion — educators’ labels for holding a student back a year or promoting a failing student to the next grade. Many researchers have found harm in holding a child back. But in Chicago and New York City, experiments in repeating school years have been successful when accompanied by extra tutoring and support programs.
Related: New research suggests repeating elementary school grades — even kindergarten — is harmful
